Geographic Atrophy Market
- DelveInsight’s Atopic Dermatitis Market Insights, Epidemiology and Market Forecast - 2034 report provides the detailed overview of the disease and in depth understanding of historical..According to DelveInsight, Geographic Atrophy Market is expected to grow at a decent CAGR by 2034.
- Immune response-targeting agents have emerged as the most advanced area of clinical research for Geographic Atrophy, marking a significant milestone as the first and only drug class to enter the market to date. The FDA approvals of IZERVAY (avacincaptad pegol) and SYFOVRE (pegcetacoplan) represent groundbreaking developments.
- IZERVAY and SYFOVRE breakthrough medications provide hope for individuals with late-stage AMD, they signify just the initial steps in advancing treatment options for Geographic Atrophy.
- Numerous therapies are currently undergoing investigation to slow the progression of Geographic Atrophy and maintain macular function in patients with dry AMD. These potential treatment options in clinical trials, with a focus on disease prevention and halting disease progression, include ALK-001, Elamipretide, EG-301, ANX 007, IONIS-FB-LRx, JNJ-1887 (AAVCAGsCD59), among others.
- Neuroprotective agents hold promise in delaying photoreceptor demise in individuals with Geographic Atrophy, thus potentially slowing disease advancement. Their effectiveness hinges on future evaluations of neurotrophic factors, necessitating a deeper understanding of their signaling pathways to extend patients' visual capabilities.
- Surgical interventions for managing GA include the PRIMA Bionic Vision System, SING-IMT implant, and the OcuDyne neuro-interventional treatment.
- AVD-104 is striving to be the third therapy approved by the FDA for treating Geographic Atrophy secondary to AMD.
- Data from both CPCB-RPE1 and OpRegen provides a very believable likelihood that RPE cells provide an effective means for treating dry AMD with Geographic Atrophy.
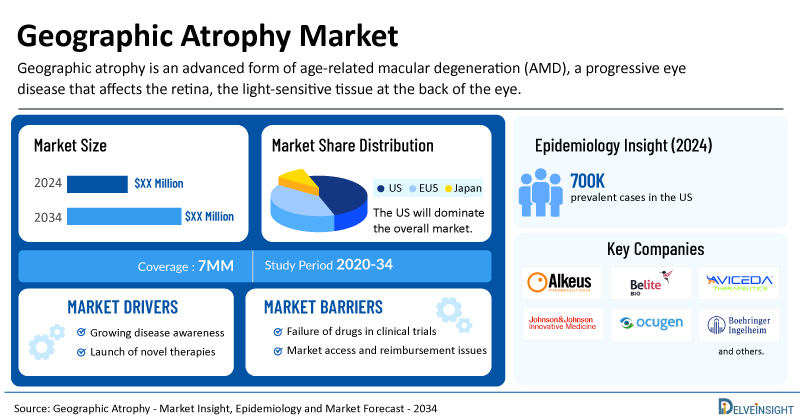
- According to DelveInsight’s estimates, the US accounted for around 700,000 Geographic Atrophy Prevalent Cases in 2023.
.jpg)
Request for unlocking the CAGR of "Geographic Atrophy Drugs Market"
DelveInsight’s "Geographic Atropy Market Insights, Epidemiology, and Market Forecast – 2034" report delivers an in-depth understanding of geographic atropy, historical and forecasted epidemiology as well as the geographic atropy market trends in the United States, EU4 (Germany, France, Italy, and Spain) and the United Kingdom, and Japan.
The Geographic Atropy Drugs Market Report provides current treatment practices, emerging drugs, geographic atropy market share of individual therapies, and current and forecasted geographic atropy market size from 2020 to 2034, segmented by seven major markets. The report also covers current geographic atropy treatment market practices/algorithms and Geographic Atrophy Unmet Needs to curate the best of the opportunities and assess the underlying potential of the market.
|
Study Period |
2020 to 2034 |
|
Forecast Period |
2024-2034 |
|
Geographies Covered |
The US, EU4 (Germany, France, Italy, and Spain) and UK, Japan |
|
Geographic Atrophy Drugs Market |
|
|
Geographic Atrophys Market Size | |
|
Geographic Atrophy Companies |
Alkeus Pharmaceuticals, Hemera Biosciences, Allegro Ophthalmics, Stealth BioTherapeutics, Regenerative Patch Technologies, Novartis, Roche, Apellis Pharmaceuticals, Iveric Bio (formerly Ophthotech Corporation), Ionis Pharmaceuticals, CellCure Neurosciences (a subsidiary of Lineage Cell Therapeutics), and others. |
|
Geographic Atrophy Epidemiology Segmentation |
|
Key Factors Driving the Growth of the Geographic Atrophy Market
Rising Geographic Atrophy Prevalence
The prevalence of geographic atrophy, an advanced form of age-related macular degeneration, is steadily rising due to global population ageing and increased life expectancy. As more individuals enter older age groups, the number of those at risk for geographic atrophy has grown significantly.
Emerging Diagnostic Technologies in Geographic Atrophy
New diagnostic technologies, such as spectral-domain OCT and fundus autofluorescence, have emerged, giving ophthalmologists a clearer picture of the eye and aiding the confirmation of anatomic endpoints for geographic atrophy.
ANX007 Milestone in Geographic Atrophy
ANX007 is the first therapeutic candidate for the treatment of geographic atrophy to receive PRIME designation in the EU, which provides early and proactive support to developers of promising medicines that may offer a major therapeutic advantage over existing treatments or benefit patients without treatment options.
Evidence Supporting RPE Cell Therapy for Geographic Atrophy
Data from both CPCB-RPE1 and OpRegen provide a very strong likelihood that RPE cells are an effective means of treating geographic atrophy.
Launch of Emerging Geographic Atrophy Drugs
The launch of geographic atrophy drugs such as Gildeuretinol (Alkeus Pharmaceuticals), Tinlarebant (Belite Bio), AVD-104 (Aviceda Therapeutics), JNJ-1887 (Johnson & Johnson Innovative Medicine), OGX-110 (Ocugenix), OCU410 (Ocugen), BI 1584862 (Boehringer Ingelheim), JNJ-1887 sCD59 (Janssen Research & Development, LLC), OpRegen (Lineage Cell Therapeutics (CellCure Neurosciences) and Roche), CT1812 (Cognition Therapeutics), Elamipretide (Stealth BioTherapeutics), EG-301 (Evergreen Therapeutics), ANX007 (Annexon Biosciences), NGM621 (NGM Biopharmaceuticals), Danicopan (ALXN2040) (AstraZeneca/Alexion Pharmaceuticals), IONIS-FB-LRx (Ionis Pharmaceuticals/Roche), CPCB-RPE1 (Regenerative Patch Technologies), and others are expected to change the dynamics of the geographic atrophy market in the coming years.
Geographic Atrophy Treatment Market
By 1965, the terminology surrounding AMD had gained widespread acceptance, with the condition classified into three clinical stages: early, intermediate, and advanced AMD. The earliest clinical sign of early AMD is the presence of drusen (>63 and ≤125 µm in diameter), which hampers the patient's ability to adapt to changes in illumination. However, the most substantial central visual loss occurs in the intermediate and advanced stages, with advanced AMD encompassing Geographic Atrophy and neovascular AMD. Geographic Atrophy is characterized by a gradual deterioration of the macular RPE, photoreceptor layer, and choroidal capillaries, resulting in progressive vision loss over time.
Diagnosis requires thorough eye examinations, and management strategies focus on slowing disease progression and optimizing remaining vision. Despite efforts, a cure for advanced dry AMD remains elusive, emphasizing the critical need for ongoing research to develop effective treatments for this debilitating condition. Diagnosing Geographic Atrophy typically involves a comprehensive eye examination, during which an ophthalmologist or optometrist evaluates the retina for characteristic signs of the condition. These signs may include the presence of drusen, small yellow deposits beneath the retina, and changes in pigmentation. Advanced imaging techniques such as optical coherence tomography (OCT) and fundus autofluorescence imaging may also be employed to assess the extent of retinal degeneration. Early detection is crucial in managing dry AMD, as it allows for timely intervention to slow disease progression and preserve vision.
Further details related to diagnosis will be provided in the report…
Geographic Atrophy Treatment
People with Geographic Atrophy typically experience impaired central vision but often retain peripheral vision, allowing them to perform many daily activities. While there is no cure for AMD, treatment options aim to slow down the progression of the disease and preserve vision. Studies suggest that supplements containing vitamins C and E, lutein, zeaxanthin, zinc, and copper may help slow the progression of dry AMD. Ongoing clinical trials are exploring various therapeutic approaches, including complement pathway inhibitors, visual cycle modulators, antioxidative therapy, neuroprotective agents, and stem cell therapy, among others. Complement pathway inhibitors show promise in reducing Geographic Atrophy progression, while stem cell therapy aims to restore retinal function. These advancements offer hope for improved management and potential restoration of vision in individuals with dry AMD. Until recently, there were no proven Geographic Atrophy. therapies.
Further details related to treatment will be provided in the report…..
Geographic Atrophy Clinical and Registrational Updates
- In October 2025, Complement Therapeutics GmbH announced FDA clearance of its Investigational New Drug (IND) application for CTx001, their lead AAV-based gene therapy. This approval allows the start of the Opti-GAIN Phase I/II trial targeting Geographic Atrophy (GA) secondary to Age-related Macular Degeneration (AMD), a disease affecting 5 million globally. CTx001 delivers a truncated Complement Receptor 1 (mini-CR1) to modulate the complement cascade, aiming to address the advanced, vision-loss-causing form of dry AMD with limited current treatments.
- In February 2025, Astellas Pharma announced that the FDA approved expanded prescribing information for IZERVAY™ (avacincaptad pegol intravitreal solution) for treating geographic atrophy (GA) secondary to age-related macular degeneration (AMD). The approval removes the limitation on the duration of dosing, offering physicians and patients more flexibility in managing GA.
- In April 2024, Ocugen announced that the data and safety monitoring board (DSMB) for the Phase I/II clinical trial for OCU410 recently convened and approved to proceed dosing with the medium dose of OCU410 for Geographic Atrophy.
- In January 2024, Apellis Pharmaceuticals announced that the Committee for Medicinal Products for Human Use (CHMP) of the European Medicines Agency adopted a negative opinion on the Marketing Authorization Application of intravitreal pegcetacoplan for the treatment of Geographic Atrophy secondary to AMD.
- In August 2023, Iveric Bio announced that the US FDA approved IZERVAY for the treatment of Geographic Atrophy secondary to AMD.
- In February 2023, Apellis Pharmaceuticals announced that the US FDA approved SYFOVRE for the treatment of Geographic Atrophy secondary to AMD.
Geographic Atrophy Epidemiology
The Geographic Atrophy epidemiology chapter in the report provides historical as well as forecasted epidemiology segmented by the total prevalent cases of AMD, late stage-specific prevalent cases of AMD, total prevalent cases of Geographic Atrophy, total diagnosed prevalent cases of Geographic Atrophy, age-specific cases of Geographic Atrophy, Geographic Atrophy cases by visual impairment in the 7MM market covering the United States, EU4 (Germany, France, Italy, and Spain) and the United Kingdom, and Japan from 2020 to 2034.
- The total prevalent cases of AMD in the 7MM was nearly 68,347,900 in 2023.
- Among the 7MM, the US accounted for the highest prevalent cases of Geographic Atrophy in 2023 while Japan accounted for the least number of prevalent cases.
- Amongst EU4 and the UK, the highest number of cases comprised from France and Germany, with France having slightly more cases than Germany.
- In 2023, the geographical atrophy accounted for nearly 955,900 cases in EU4 and the UK.
- According to the estimates, in Japan, it is observed that age-specific cases of Geographic Atrophy were most prevalent in the 85+ years age group, accounting for over 40% of total cases in 2023.
- Although there are relatively equal numbers of neovascular AMD and Geographic Atrophy in White populations, late AMD is less common among Japanese people than among white subjects. In Asian countries, although the prevalence of Geographic Atrophy is low, the rapidly aging population means that Geographic Atrophy is becoming an increasingly urgent and unmet medical need. The difference in the prevalence of AMD among races is also partly owing to genetic background; for example, some single nucleotide polymorphisms (SNPs) in complement factors are associated with AMD in Caucasians.
.jpg)
Unlock comprehensive insights! Click Here to Purchase the Full Report @ Geographic Atrophy Prevalence
Geographic Atrophy Drug Chapters
The drug chapter segment of the Geographic Atrophy report encloses a detailed analysis of the late-stage (Phase III ) and mid-stage (Phase II/III and Phase II) pipeline drugs. The current key players include Belite Bio (Tinlarebant), Alkeus Pharmaceuticals (ALK-001), Aviceda Therapeutics (AVD-104), and others. The drug chapter also helps understand the Geographic Atrophy clinical trial details, pharmacological action, agreements and collaborations, approval, and patent details, and the latest news and press releases.
Marketed Geographic Atrophy Drugs
IZERVAY (avacincaptad pegol): Astellas Pharma/Iveric Bio
IZERVAY, also known as avacincaptad pegol is designed to target and inhibit complement factor C5. Complement factor C5 is a central component of the complement cascade and is believed to be involved in the development and progression of dry AMD. IZERVAY binds to C5 and inhibits its cleavage into the terminal fragments C5a and C5b. By inhibiting the formation of complement system terminal fragments, IZERVAY may decrease the activation of inflammasomes and the formation of membrane attack complexes (MAC), which occur at the end of the complement cascade. In August 2023, the US FDA approved IZERVAY for the treatment of Geographic Atrophy secondary to AMD. Concurrently, Astellas Pharma announced that the European Medicines Agency (EMA) has accepted Iveric Bio’s MAA for avacincaptad pegol for the treatment of Geographic Atrophy secondary to AMD.
SYFOVRE (pegcetacoplan): Apellis Pharmaceuticals
SYFOVRE is a targeted C3 inhibitor designed to regulate excessive complement activation, which can lead to the onset and progression of many serious diseases. Pegcetacoplan is a type of synthetic cyclic peptide conjugated to a polyethylene glycol polymer that binds specifically to C3 and C3b. The company is evaluating pegcetacoplan in several clinical studies, including paroxysmal nocturnal hemoglobinuria (PNH), Geographic Atrophy (GA), cold agglutinin disease (CAD), warm antibody autoimmune hemolytic anemia (wAIHA), complement-dependent nephropathies (CDN). SYFOVRE is the first and only approved therapy for Geographic Atrophy secondary to AMD. In January 2024, the CHMP of the EMA adopted a negative opinion on the MAA of intravitreal pegcetacoplan for the treatment of Geographic Atrophy secondary to AMD.
Read Here @ PEGCETACOPLAN (APL-2) Drug Insight
Emerging Geographic Atrophy Drugs
Tinlarebant (LBS-008): Belite Bio
Tinlarebant is a novel oral therapy that is intended to reduce the accumulation of toxins in the eye that cause STGD1 and contribute to GA, or advanced dry AMD. These toxins are by-products of the visual cycle, which is dependent on the supply of vitamin A (retinol) to the eye. A 2-year global Phase III PHOENIX trial is ongoing. PHOENIX is a multicenter, randomized, double-masked, placebo-controlled study to evaluate the safety and efficacy of Tinlarebant in Geographic Atrophy subjects. In November 2023, Belite Bio announced the approval from the Medicines and Healthcare Products Regulatory Agency (MHRA) of the United Kingdom (UK) for the Phase III clinical trial of Tinlarebant in Geographic Atrophy or the PHOENIX study.
Gildeuretinol (ALK-001): Alkeus Pharmaceuticals
Allegro Ophthalmics is developing risuteganib (also known as ALG-1001), a breakthrough integrin-regulating therapy for ocular health that reduces mitochondrial dysfunction involved in intermediate dry AMD. By targeting multiple pathways, risuteganib helps reduce the cellular burden of oxidative stress and restores retinal homeostasis. Research suggests that risuteganib interferes with integrin functions that have been implicated in retinal diseases, giving it the potential for a broad-spectrum effect on different pathways of oxidative stress. Currently, the company has received the US FDA agreement under Special Protocol Assessment (SPA) for Phase IIb/III clinical trial of risuteganib for the treatment of intermediate, non-exudative age-related macular degeneration (dry AMD). Moreover, the overall protocol design of Phase IIb/III dry AMD clinical trial was finalized by the US FDA. According to the company’s recent presentation, a Phase III study of gildeuretinol in 200 patients with Geographic Atrophy secondary to AMD has recently been completed and is expected to read out topline data in 2024.

Detailed emerging therapies assessment will be provided in the final report.
Geographic Atrophy Drug Class Insight
Integrin Inhibitor
Integrin inhibitor have been effective in several preclinical models, and promising results have been reported thus far from clinical trials. Indeed, most of the current αvβ3 clinical investigations centre on treating eye diseases (age-related macular degeneration (AMD) using topically dosed or intravitreally injected small molecules and peptides, although these molecules also inhibit other αv integrins and/or α5β1 to varying degrees. The molecules that have progressed the furthest in the clinic are risuteganib (Luminate, Allegro Ophthalmics). It is a small peptide integrin regulator protecting cells of the human RPE against dysfunction related to oxidative stress. With age, decreased mitochondrial oxidative phosphorylation increases the generation of reactive oxygen species and decreased metabolic activity, thus negatively affecting cellular bioenergetics and mitochondrial functioning. It is also known that RPE mitochondrial dysfunction contributes to the oxidative stress causing AMD.
Check Here @ Alpha 4 Beta 7 (A4b7) Integrin Inhibitor Pipeline
Complement C5 inhibitors
Complement C5 inhibitors target the complement cascade, a part of the immune system involved in inflammation and tissue damage. By inhibiting C5, these drugs help mitigate the inflammatory response and prevent further damage to retinal cells. Additionally, complement inhibition may also have a protective effect on neighboring healthy cells, preserving overall retinal function.
In the advanced stages of dry AMD, complement C5 inhibitors play a crucial role in addressing the underlying inflammatory processes that contribute to disease progression. Dry AMD, particularly in its advanced form known as Geographic Atrophy, is characterized by the gradual degeneration of retinal cells, leading to vision loss. Research indicates that complement dysregulation and chronic inflammation play significant roles in the pathogenesis of AMD.
Geographic Atrophy Market Outlook
Geographic Atrophy, the advanced stage of dry AMD, has emerged as a prominent focus of research. Current investigations predominantly center on therapies targeting complement inhibitors of C3 and C5, pivotal factors in triggering inflammation and subsequent cell death within the eye. Extensive studies led by the National Eye Institute and esteemed researchers globally have unveiled the likelihood of an overactive complement system as a central player in the genesis of dry AMD and its evolution toward Geographic Atrophy.
Enhancing comprehension of the pathophysiology of Geographic Atrophy resulting from dry AMD can benefit patients, optometrists, and ophthalmologists alike. This improved understanding could lead to more accurate identification and diagnosis of patients, potentially lessening the burden of the disease and extending their visual function over time.
The landscape of research and development in intermediate AMD has shifted to dry AMD, exemplified by Stealth Biotherapeutics redirecting its focus toward dry AMD. As seen in Elamipretide, a mitochondria-targeting antioxidant, has progressed to Phase II trials for dry AMD following promising outcomes in Phase I trials for intermediate AMD.
Immune response-targeting agents have emerged as the most advanced area of clinical research for Geographic Atrophy, marking a significant milestone as the first and only drug class to enter the market to date. The FDA approvals of IZERVAY (avacincaptad pegol) and SYFOVRE (pegcetacoplan) represent groundbreaking developments. Both medications have demonstrated their ability to effectively slow down the progression of Geographic Atrophy, thereby mitigating vision loss. These approvals signal a transformative shift in clinical practice, research priorities, investment decisions, and healthcare planning. While these breakthrough medications provide hope for individuals with late-stage dry AMD, they signify just the initial steps in advancing treatment options for Geographic Atrophy.
Numerous therapies are currently undergoing investigation to slow the progression of Geographic Atrophy and maintain macular function in patients with dry AMD. These potential treatment options in clinical trials, with a focus on disease prevention and halting disease progression, include ALK-001, Tinlarebant (LBS-008), Risuteganib, EG-301, ANX 007, IONIS-FB-LRx, NGM 621, JNJ-1887 (AAVCAGsCD59), among others.
Detailed market assessment will be provided in the final report.
Key Findings
- The setback in safety definitely slowed down SYFOVRE's momentum and put a damper on its early lead in the market. However, despite this setback, Apellis reported excellent Q4 sales figures, showcasing impressive growth for SYFOVRE. Looking ahead, with new drugs anticipated to receive regulatory approval between 2025 and 2027, it will be intriguing to observe how the landscape of Geographic Atrophy evolves.
- Currently, there are no imminent threats to SYFOVRE or IZERVAY, as no medications are poised for approval in the near future.
.jpg)
Geographic Atrophy Drugs Uptake
This section focuses on the uptake rate of potential Geographic Atrophy drugs expected to be launched in the market during 2024–2034. The landscape of Geographic Atrophy treatment has experienced a transformation with the uptake of novel drugs. These innovative therapies are redefining standards of care. Furthermore, the increased uptake of these transformative drugs is a testament to the unwavering dedication of retinal physicians, ophthalmologists, professionals, and the entire healthcare community in their tireless pursuit of advancing eye care. This momentous shift in treatment paradigms is a testament to the power of research, collaboration, and human resilience.
Geographic Atrophy Pipeline Development Activities
The Geographic Atrophy Drugs Market report provides insights into therapeutic candidates in Phase III, Phase II/III,and Phase II. It also analyzes key players involved in developing targeted therapeutics. Companies like Belite Bio, Alkeus Pharmaceuticals, and others are actively engage in late and mid stage research and development efforts for Geographic Atrophy. The pipeline of Geographic Atrophy possesses potential drugs. However, there is a positive outlook for the therapeutics market, with expectations of growth during the forecast period (2024–2034).
Pipeline Development Activities
The Geographic Atrophy Drugs Market report covers information on collaborations, acquisitions and mergers, licensing, and patent details for Geographic Atrophy emerging therapy.
Take Your Research to the Next Level! Click Here to Get Access to the Full Pipeline Report @ New Drugs for Geographic Atrophy
KOL Views
To keep up with current Geographic Atrophy market trends, we take KOLs and SMEs’ opinions working in the domain through primary research to fill the data gaps and validate our secondary research. Industry Experts contacted for insights on the dry AMD evolving treatment landscape, patient reliance on conventional therapies, patient therapy switching acceptability, and drug uptake, along with challenges related to accessibility, including Retinal Specialist, ophthalmologist, eye specialist, and others.
DelveInsight’s analysts connected with 30+ KOLs to gather insights; however, interviews were conducted with 15+ KOLs in the 7MM. Centers such as the Institute for Saint John’s Health Center in California, Byers Eye Institute, McPherson Eye Research Institute, Retina specialist at Providence Saint John’s Health Center, Department of Ophthalmology, Ophthalmic Consultants etc., were contacted. Their opinion helps understand and validate current and emerging therapy treatment patterns or dry AMD market trends. This will support the clients in potential upcoming novel treatments by identifying the overall scenario of the market and the unmet needs.
Qualitative Analysis
We perform Qualitative and market Intelligence analysis using various approaches, such as SWOT analysis and Analyst views. In the SWOT analysis, strengths, weaknesses, opportunities, and threats in terms of disease diagnosis, patient awareness, patient burden, competitive landscape, cost-effectiveness, and geographical accessibility of therapies are provided. These pointers are based on the Analyst’s discretion and assessment of the patient burden, cost analysis, and existing and evolving treatment landscape.
Geographic Atrophy Drugs Market Access and Reimbursement
Referring patients with wet AMD to a retina specialist is common practice, but for patients with intermediate AMD, optometrists may feel that their options are limited. These patients require frequent monitoring to watch for the development of wet AMD. The current standard of care used by some eye care practitioners includes sending patients home with an Amsler grid and instructing them to use the grid every day to monitor their vision and report back to them with any changes in their vision. Although many optometrists still rely on the Amsler grid, clinical experience and research have shown that these and other high-risk patients often fail to use the Amsler grid between office visits to catch the earliest signs of neovascularization.
IZERVAY Patient assistance program is designed to meet the unique needs of eligible patients. Whether patients have commercial insurance, insurance that does not cover IZERVAY, are uninsured, or have government-issued insurance (such as Medicare), help may be available.
IZERVAY VisionPoints is a free patient engagement and educational support program for people to learn about GA and treatment with IZERVAY. IZERVAY VisionPoints is available to residents of the United States and Puerto Rico only. Health information is provided for educational purposes only and is not intended to replace discussions with a healthcare provider. All decisions regarding patient care must be made with a healthcare provider, considering the unique characteristics of the patient. A prescription for IZERVAY is not required to participate in the IZERVAY VisionPoints program. Gift cards are limited to no more than USD 15 each, with an annual maximum of USD 75 per year. Void where prohibited by law.
Detailed market access and reimbursement assessment will be provided in the final report.
Geographic Atrophy Therapeutics Market Report Scope
- The Geographic Atrophy therapeutics market report covers a segment of key events, an executive summary, and a descriptive overview of Geographic Atrophy, explaining its causes, signs, symptoms, pathogenesis, and currently used therapies.
- Comprehensive insight into the epidemiology segments and forecasts, disease progression, and treatment guidelines has been provided.
- Additionally, an all-inclusive account of the emerging therapies and the elaborative profiles of late-stage and prominent therapies will impact the current treatment landscape.
- A detailed review of the Geographic Atrophy market, historical and forecasted market size, market share by therapies, detailed assumptions, and rationale behind our approach is included in the report, covering the 7MM drug outreach.
- The Geographic Atrophy therapeutics market report provides an edge while developing business strategies by understanding trends through SWOT analysis and expert insights/KOL views, patient journey, and treatment preferences that help shape and drive Geographic Atrophy.
Geographic Atrophy Therapeutics Market Report Insights
- Geographic Atrophy Patient Population
- Geographic Atrophy Therapeutic Approaches
- Geographic Atrophy Pipeline Analysis
- Geographic Atrophy Market Size
- Geographic Atrophy Market Trends
- Existing and Future Geographic Atrophy Market Opportunity
Geographic Atrophy Therapeutics Market Report Key Strengths
- 11 Years Forecast
- The 7MM Coverage
- Geographic Atrophy Epidemiology Segmentation
- Key Cross Competition
- Geographic Atrophy Drugs Uptake
- Key Geographic Atrophy Market Forecast Assumptions
Geographic Atrophy Therapeutics Market Report Assessment
- Current Geographic Atrophy Treatment Market Practices
- Geographic Atrophy Unmet Needs
- Geographic Atrophy Pipeline Product Profiles
- Geographic Atrophy Therapeutics Market Attractiveness
- Qualitative Analysis (SWOT and Analyst Views)
FAQs
- What was the Geographic Atrophy market size, the Geographic Atrophy treatment market size by therapies, market share (%) distribution in 2023, and what would it look like by 2034? What are the contributing factors for this growth?
- What can be the future treatment paradigm for Geographic Atrophy?
- What are the disease risks, burdens, and Geographic Atrophy Unmet Needs? What will be the growth opportunities across the 7MM concerning the patient population with Geographic Atrophy?
- What are the current options for the Geographic Atrophy treatment? What are the current guidelines for treating Geographic Atrophy in the 7MM?
- What are the recent novel therapies, targets, mechanisms of action, and technologies being developed to overcome the limitations of existing therapies?
- What is the patient share in Geographic Atrophy?
Reasons to Buy
- The Geographic Atrophy treatment market report will help develop business strategies by understanding the latest trends and changing treatment dynamics driving Geographic Atrophy.
- Insights on patient burden/disease prevalence, evolution in diagnosis, and factors contributing to the change in the epidemiology of the disease during the forecast years.
- Understand the existing Geographic Atrophy market opportunities in varying geographies and the growth potential over the coming years.
- Identifying strong upcoming players in the market will help devise strategies to help get ahead of competitors.
- Detailed analysis ranking of class-wise potential current and emerging therapies under the analyst view section to provide visibility around leading classes.
- Highlights of access and reimbursement policies of current therapies, barriers to accessibility of expensive off-label therapies, and patient assistance programs.
- To understand Key Opinion Leaders’ perspectives around the accessibility, acceptability, and compliance-related challenges of existing treatment to overcome barriers in the future.
- Detailed insights on the unmet needs of the existing market so that the upcoming players can strengthen their development and launch strategy.
Are you excited to know more details? Please read here-
- Geographic Atrophy Market: Infographics
- Mapping The Pipeline Development In The Geographic Atrophy Market
- Entry of Izervay: First Geographic Atrophy Treatment to Slow Progression
- Geographic Atrophy Treatment Market: Novel Therapies to Enter the Market
- AstraZeneca’s Voydeya FDA Approval; Akebia’s Vafseo FDA Approval; Bristol Myers Squibb’s Phase III YELLOWSTONE Trial Update; Astellas’ IZERVAY FDA Approval; AstraZeneca’s Truqap and Faslodex MHLW Approval
- Latest DelveInsight Blogs

-pipeline-insight%2C-2024.png&w=256&q=75)